
Teeth Whitening Shade Relapse: Why Buyers Return Products
What Shade Relapse Actually Means and Why It Differs From Stain Recurrence Photo by Ozkan Guner on Unsplash Teeth whitening shade relapse is not the same thing as your coffee habit catching up with you. Having worked with formulators and buyer teams across the supply chain, I can confirm this distinction gets flattened in marketing … Read more
What Shade Relapse Actually Means and Why It Differs From Stain Recurrence

Teeth whitening shade relapse is not the same thing as your coffee habit catching up with you. Having worked with formulators and buyer teams across the supply chain, I can confirm this distinction gets flattened in marketing copy—and that flattening costs money in returns.
Shade relapse is the measurable darkening of tooth color that occurs after a whitening protocol ends, even when the consumer changes nothing about their diet or hygiene. The tooth structure itself reverts toward its pre-treatment chromatic state. Stain recurrence, by contrast, is extrinsic: new pigments depositing on enamel from wine, tobacco, curry, or coffee. The mechanism differs entirely. The consumer complaint sounds identical.
When a buyer receives a return request citing “didn’t last,” they rarely know which phenomenon they are dealing with. Was the peroxide concentration too low to reach the chromophores deep in enamel? Did the consumer stop at shade A2 when the dentin underneath was always going to read yellower by week three? Or did they simply return to their red wine routine? The return reason line does not say.
Clinical literature confirms this ambiguity is significant. Shade relapse begins after bleaching ends and can continue for weeks, according to studies comparing post-treatment color change trajectories. Some research reports that relapse magnitude tends to be larger after single-session in-office protocols compared to multi-day supervised at-home bleaching, though other studies report relatively stable whitening outcomes over six months. Early measurable regression—sometimes within the first week—has been documented in certain protocols. The data is mixed, and that variability is exactly what B2B buyers need to understand before writing product claims or setting consumer expectations.
Stain recurrence is a behavioral problem. Shade relapse is a product performance problem. Conflating the two in your QC protocols or customer service scripts means you solve the wrong failure mode. For more on how whitening ingredient choices affect product outcomes, see our ingredient analysis series.
The Chromatic Science Behind Post-Whitening Color Regression
Tooth color is not a surface property. The industry frequently mischaracterizes whitening as stripping paint when it is more like altering the light-transmission properties of a semi-translucent composite.
Enamel is approximately 95–97% mineral by weight (primarily hydroxyapatite), highly crystalline, and—crucially—translucent. The color you perceive comes primarily from the dentin beneath, modified by enamel’s optical properties and any extrinsic pigmentation on the surface. Peroxide-based whitening works by diffusing through enamel microstructure and oxidizing chromophores embedded in the dentin matrix. These chromophores are typically conjugated organic molecules—including metalloporphyrins and polymeric degradation products from aging—that absorb light in the yellow-red spectrum.
Oxidation breaks these conjugated systems. The molecule no longer absorbs the same wavelengths; more light reflects back in the blue-white range; the tooth looks whiter. But relapse lives in what happens next. The current hypothesis, supported by in vitro color-stability research, suggests that some chromophores may partially re-form or that denatured organic matrix in the dentin can reorganize in ways that restore some original color signaling. The precise biochemical pathway remains an active area of investigation.
Saliva complicates the picture. It is a reducing environment containing thiocyanates, ascorbate, and sulfhydryl compounds. These agents may, over time, contribute to partial reversal of oxidative changes in tooth structure. Temperature and pH fluctuations in the oral cavity can accelerate some reactions. The tooth is not a closed system; it is a warm, wet, chemically active environment where “permanent” color change is better understood as “metastable.”
The chromatic result is not just darkening but often a hue shift back toward yellow. Consumers notice yellowing more acutely than uniform darkening. A tooth that relapses from B1 to A2 may read as “failed” even if the lightness value barely changed, because the hue moved in the direction consumers associate with discoloration.
Perception research in dental aesthetics suggests consumers judge whitening success by hue change at least as much as by value (lightness) change. Yet most shade guides and marketing materials emphasize “how many shades lighter,” treating the problem as one-dimensional. For B2B buyers, this mismatch between measurement and perception creates a gap that drives dissatisfaction.
How Peroxide Concentration and Exposure Time Influence Teeth Whitening Shade Relapse Speed
More peroxide does not always mean less relapse. Sometimes it means more.
Higher concentrations—in the range of 25–40% hydrogen peroxide used in some professional in-office protocols—produce rapid initial results. The oxidation front moves fast, chromophore destruction is extensive, and the consumer leaves the chair dramatically lighter. But the same intensity may create greater disruption in the dentin matrix. Research on enamel surface changes after exposure to high-concentration peroxide gels suggests more pronounced structural effects compared to lower concentrations applied over longer periods.
The clinical observation that relapse can be larger after in-office protocols than supervised at-home bleaching may connect to this dynamic. Lower concentrations (3–10% carbamide peroxide, yielding roughly 1–3.5% hydrogen peroxide upon decomposition) applied over multiple days may produce more structurally integrated color change. The oxidation proceeds more gradually; the matrix retains more native organization.
Exposure time matters independently. A 15-minute light-accelerated session and a multi-hour tray session differ not only in convenience but in how completely the peroxide penetrates enamel, how deeply it reaches into dentin, and how uniformly the chromophore oxidation proceeds. Uneven oxidation creates internal color boundaries that can read as patchy fading during relapse.
The consumer who uses a 10% carbamide peroxide tray nightly for two weeks may hit the same shade endpoint as one who does two in-office sessions. But their relapse trajectories can diverge at 30, 60, and 90 days post-treatment. For B2B buyers evaluating supplier formulations, the question is not just “what shade does it reach?” but “what shade does it hold at 90 days, and what is the slope of regression afterward?”
Market trends push in conflicting directions. At-home kits continue driving volume, with product innovation moving toward peroxide-free systems including PAP (phthalimidoperoxycaproic acid), nano-hydroxyapatite, and light-activated systems. Some of these alternatives demonstrate reduced sensitivity profiles, but their teeth whitening shade relapse data is less well documented in peer-reviewed literature compared to peroxide benchmarks. A buyer selecting a PAP-based supplier for the European market—where peroxide concentration limits are more restrictive—needs relapse data that can be meaningfully compared to peroxide baselines. That data remains sparse.
Most suppliers optimize for immediate shade change because that is what converts at point of sale. Relapse resistance is harder to demonstrate in short-form content, harder to quantify without longitudinal measurement. But it determines whether that customer repurchases or returns.
VITA Shade Guides vs. Digital Spectrophotometry: Measuring Real Results for Product Claims
If you are writing product claims without understanding how your supplier measured shade, you are building on unreliable ground.
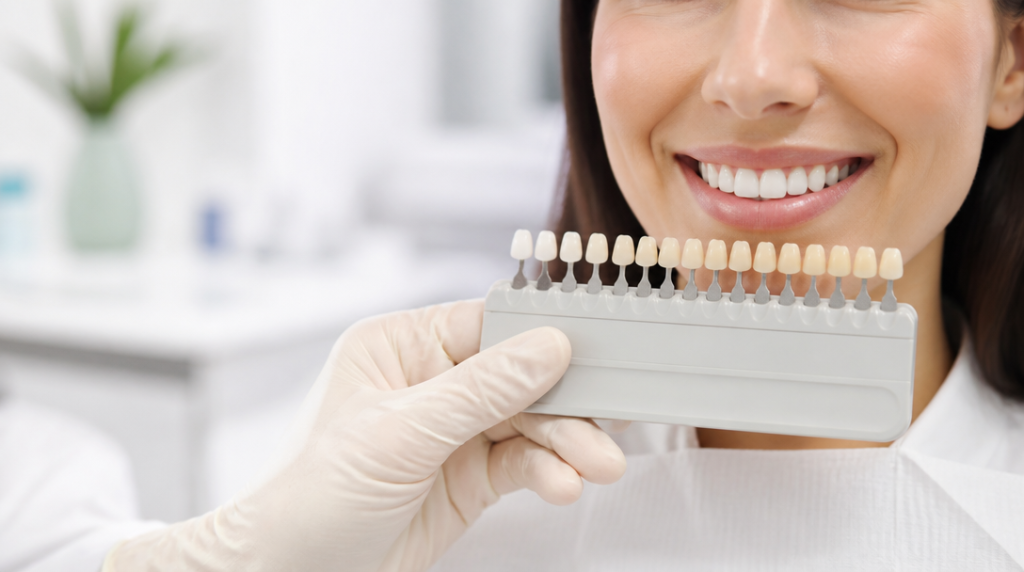
The VITA Classical Shade Guide—16 tabs arranged in groups A through D—remains the industry default for visual shade matching. It is also genuinely problematic for documenting relapse. The tabs are fabricated from ceramic material, not natural tooth structure. They are arranged in a hue-based sequence that does not map cleanly onto perceptual uniformity. The steps between adjacent tabs are not equal in human visual perception. Two calibrated clinicians can disagree by a full tab on the same tooth under different lighting conditions.
For relapse documentation specifically, the VITA guide has a resolution problem. A consumer’s tooth may move half a VITA tab in six weeks—detectable to them, visible in before-and-after photos, but not capturable in a system that only reports whole-tab increments. Your “clinically proven to whiten 3 shades” claim may obscure a sub-tab relapse that drives returns.
Digital spectrophotometry—using devices such as the VITA Easyshade or comparable instruments—measures CIELAB values: L* for lightness, a* for red-green, b* for yellow-blue. This is where measurement precision improves substantially. A ΔE (total color difference) of approximately 1.0 represents the threshold of human perceptible difference under controlled conditions. In clinical practice, consumers often notice color changes below ΔE 2.0. Relapse documented as ΔE over time gives you a slope, a rate, and a basis for prediction.
Most B2B buyers do not demand spectrophotometric data from suppliers. They accept VITA-tab claims because those claims are easier to market. “4 shades whiter” fits on packaging. “ΔE = 8.3, with ΔE relapse of 2.1 at 90 days” does not. Yet the latter is what predicts return rates and customer satisfaction over time.
Relevant regulatory frameworks reference product standards without mandating specific measurement methods. In the United States, FDA classifies tooth bleaching products under 21 CFR 872.6660, which defines the product category and applicable device controls. ISO 28399 specifies requirements and test methods for external tooth bleaching products, addressing formulation, packaging, labeling, and manufacturer instructions. Neither standard mandates spectrophotometric shade measurement for compliance. However, a supplier declaration of conformity to ISO 28399 that includes instrumental color measurement is technically stronger than one relying solely on clinician visual matching.
For buyers vetting North American suppliers: request CIELAB data at baseline, immediate post-treatment, 2 weeks, 4 weeks, and 12 weeks. If the supplier has only VITA-tab data, ask how many evaluators participated, under what lighting protocol, and with what inter-rater reliability metric. If they cannot answer, their “clinical proof” is weaker than it appears.
European buyers face additional complexity. Regulation (EC) No 1223/2009 governs cosmetic products and sets specific concentration limits for hydrogen peroxide in whitening products available to consumers. Products containing or releasing between 0.1% and 6% hydrogen peroxide are restricted to use by dental practitioners or under their direct supervision for consumers over 18. Product classification as cosmetic versus medical device varies by member state implementation and affects permissible claims and evidence requirements. A supplier with robust spectrophotometric data may still face limitations on how that data can be used in consumer-facing claims depending on national rules.
Formulation Factors That Slow Teeth Whitening Shade Relapse in At-Home Products
The active ingredient is not the whole story. Identical peroxide concentrations from different suppliers can produce meaningfully different relapse curves, and the difference lies in the surrounding formulation.
pH buffering matters substantially. Peroxide decomposition is pH-dependent; too alkaline and it decomposes before adequate penetration, too acidic and it risks enamel demineralization without effective bleaching. But pH also affects the post-treatment environment. A formulation that maintains a mildly alkaline or neutral state at the enamel surface may create conditions less favorable to chromophore re-formation compared to one that creates acidic conditions. Most suppliers optimize pH for treatment-phase efficacy, not for post-treatment color stability.
Desensitizing additives—potassium nitrate, sodium fluoride, nano-hydroxyapatite—are typically positioned as comfort ingredients. They may also affect relapse indirectly. Fluoride and hydroxyapatite deposition can alter enamel’s surface optical properties, potentially masking early relapse through changes in surface gloss or translucency. Some supplier data sets suggest a correlation between mineralization-step inclusion and improved color retention, though the mechanism remains under investigation in published literature and should not be treated as established.
Thickeners and vehicle systems control peroxide distribution. A carbomer gel that releases peroxide steadily over 30 minutes produces different oxidation kinetics than a thin-film strip that floods the surface then depletes rapidly. The gel may create more uniform chromophore destruction; the strip may create sharper oxidation gradients. Gradient-rich color change is more perceptually unstable—it reads as patchy fading rather than uniform regression.
The trend toward incorporating remineralization and fluoride steps aligns with structural stabilization goals. Engineered gels that include post-treatment mineralization are not just sensitivity reduction strategies; they may function as color-stability plays as well. For buyers, the question is whether a supplier’s “enamel repair” claim includes any color-retention data, or whether it is positioned purely around comfort and safety.
Peroxide-free alternatives—PAP, sodium bicarbonate systems, enzymatic approaches—present a different formulation challenge regarding relapse. PAP oxidizes stains through a different radical pathway than hydrogen peroxide; the claim is reduced sensitivity, but the relapse question remains open. Does PAP penetrate to dentin chromophores effectively, or does it primarily affect extrinsic stain? If the latter, then what consumers experience as “relapse” is really stain recurrence, and the product may be mispositioned for consumers expecting structural whitening. Buyers should request penetration and depth-of-effect studies, not just surface color data.
Light-activated systems add another variable. FDA classifies intraoral heat and light sources under 21 CFR 872.6475 as Class I medical devices, but this classification addresses device safety rather than whitening efficacy enhancement. The clinical evidence on whether light activation meaningfully improves whitening product outcomes or relapse resistance remains mixed, with several systematic reviews finding no consistent benefit beyond the peroxide formulation alone.
Practical Framework for B2B Buyers Evaluating Shade Relapse Risk
Teeth whitening shade relapse is ultimately a supply-chain quality problem that shows up as a consumer satisfaction problem. Buyers who treat it as such can reduce return rates and strengthen product claims. Below is a practical evaluation framework.
Supplier data requests should include:
- CIELAB (L*, a*, b*) values at baseline, immediate post-treatment, 14 days, 30 days, and 90 days minimum
- Sample size and study design (controlled versus open-label, in vivo versus in vitro)
- Relapse slope calculation (ΔE per week post-treatment)
- Inter-rater reliability metrics if visual shade matching was used
- Penetration depth data for peroxide-free formulations
Return-reason classification should separate:
- “Color reverted” complaints (potential shade relapse—formulation issue)
- “Stains came back” complaints (potential extrinsic recurrence—behavioral or expectation issue)
- “Never worked” complaints (potential efficacy failure—different root cause entirely)
Claim language should reflect measurement precision. “Whitens up to X shades” based on VITA matching carries different evidentiary weight than “Achieves ΔE of X with ≤Y relapse at 90 days” based on spectrophotometry. The second version is harder to market but more defensible and more predictive of customer retention.
Understanding shade relapse as a distinct, measurable phenomenon—separate from stain recurrence, influenced by formulation variables beyond active ingredient concentration, and measurable only with appropriate instrumentation—gives buyers a concrete framework for supplier evaluation, claim substantiation, and return-rate reduction.
References
- Akal N, et al. “Bleaching efficacy and quality of life of different bleaching techniques – randomized controlled trial.” Clinical Oral Investigations, 2022. PMID: 35976497. https://pubmed.ncbi.nlm.nih.gov/35976497/
- Matis BA, et al. “Clinical evaluation of in-office and at-home bleaching treatments.” Operative Dentistry, 2003. PMID: 12670065. https://pubmed.ncbi.nlm.nih.gov/12670065/
- Pinto CF, et al. “Enamel Surface Changes After Exposure to Bleaching Gels Containing Carbamide Peroxide or Hydrogen Peroxide.” Operative Dentistry, 2016. DOI: 10.2341/15-010-l
- Ahrari F, et al. “Effect of carbamide peroxide and hydrogen peroxide on enamel surface: an in vitro study.” Clinical Oral Investigations, 2011. DOI: 10.1007/s00784-010-0439-1
- ISO 28399:2021. “Dentistry – External tooth bleaching products.” International Organization for Standardization. https://www.iso.org/standard/76742.html
- Regulation (EC) No 1223/2009 of the European Parliament and of the Council on cosmetic products. https://eur-lex.europa.eu/legal-content/EN/ALL/?uri=CELEX:32009R1223
- U.S. FDA 21 CFR 872.6660 – Tooth bleaching devices. https://www.ecfr.gov/current/title-21/chapter-I/subchapter-H/part-872/subpart-G/section-872.6660
Disclaimer
This article is for informational purposes only. LLRNCARE makes no representations or warranties about the completeness, accuracy, or reliability of the information. Any reliance is at your own risk.
For professional dental advice, consult a qualified dental professional. For regulatory compliance, consult legal experts.
—